This piece is part of our new Deeper Dive series where Spark’s experts unpack complex technical topics. This piece is geared toward practitioners in the livestock enteric methane field. For a more general introduction to livestock enteric methane—what it is, why it matters, and what potential solutions are emerging—start here.
Cattle produce methane as part of their digestion, wasting energy that might be used more productively. It may be tempting to claim that reducing the amount of methane cattle produce will thus automatically boost productivity. But proving that energy savings translate into more meat or milk is scientifically challenging, requiring carefully designed studies and large trials.
Without solid evidence, unsupported claims of productivity gains from methane-reducing innovations risk doing more harm than good by misleading investors, regulators, and producers. To advance the field, we need good data and rigorous measurements.
Many startups in the enteric methane space are now claiming that their technologies not only cut emissions but also improve productivity, helping animals convert feed more efficiently into milk or meat. These claims matter. If true, they could transform the economics of methane mitigation, creating a win-win for both climate and producers. But the evidence for these productivity gains remains weak, and in many cases, is being assumed rather than demonstrated.
The logic is appealing: reducing methane should, in theory, free up energy that could be redirected toward growth or milk production. Yet in practice, the rumen is a complex biological system, and there’s little empirical proof that this “liberated energy” translates into measurable performance improvements, and one study very robustly demonstrated that any productivity gains via the classic redirection mechanisms is likely limited ( at least for one mode of action). For many early-stage ventures, collecting that kind of rigorous productivity data is beyond their current technical or financial capacity. Still, treating productivity as a given is risky—it can distort impact estimates, mislead investors, and erode confidence in the entire field if promised gains fail to materialize.
Q. Is that a rhetorical statement, or would you like to do the math?
A: I’d like to do the math.

In livestock production, productivity boils down to how efficiently animals convert feed into products like meat or milk. For simplicity, let’s stick with beef production.
Here are a few key metrics used to evaluate productivity in livestock systems:
Feed is the largest expense in livestock operations, so improving FCR, or otherwise improving the rate of weight gain per unit of feed, directly improves both productivity and profitability. With these basics in mind, let’s look at the mechanics of enteric methane and potential productivity benefits from mitigating it.
Enteric methane represents 2–12% of the energy from feed in ruminant livestock like cattle, sheep, and goats, with an average of around 6%. Factors such as breed, diet, and the rumen microbiome influence this percentage.
Now, assume we have a product that reduces enteric methane by 50%. That liberates 3% of the energy from feed that could—potentially—be redirected into productivity gains like increased meat or milk production. But does it? This is where things get tricky.
Demonstrating that a 3% energy liberation improves Feed Conversion Ratio (FCR) is not as simple as it sounds. Measuring Dry Matter Intake (DMI) and Average Daily Gain (ADG) accurately requires contending with both variability and uncertainty in the data. Even if we reduce methane by 50%, productivity would improve by at most 3%. And you don't need to be a statistician to know that it's much harder to detect a 3% change than a 50% one. After all, it's much easier to tell when someone is 2 feet taller than when they’re only 2 inches taller.
DMI measurements are relatively straightforward in controlled experimental settings (though they are much more difficult with grazing animals). Feed intake is closely monitored, and smart feeding systems can weigh feed given and feed left uneaten. While minor variability exists (e.g., feed spilling), these systems are robust, and uncertainty in DMI measurements is minimal.
ADG, on the other hand, is a different beast. Even animals of the same breed, diet, and rough size show enormous variability in daily weight gain. For example, a 300 kg steer might gain anywhere from 0.8 to 2 kg per day, depending on individual factors.
To reduce variability and improve accuracy, trials must last 49–70 days or longer, allowing daily fluctuations in weight to average out. This is because factors like water intake, time since last feed intake, bowel movements, and scale error can cause day-to-day weight variations of 5–18 kilograms, dwarfing the small daily weight gains we’re trying to measure.
The Statistical Challenge of Detecting Efficiency Gains
Let’s consider an average scenario first, then we will consider a very generous scenario:
For both, we will use the following assumptions:
First, let’s assume our methane mitigation product reduced emissions by 50% and liberated 3% of feed energy (assuming a 6% original energy loss). To prove this energy was converted into improved efficiency, we need to detect a 3% change in FCR.
Detecting this small effect size requires powering the study to minimize Type I errors (false positives, also known as alpha) and Type II errors (false negatives, also known as beta). With a tolerance of 5% for Type I errors and 25% for Type II errors (typical for ruminant studies), we’d need 542 animals per group, or 1,084 total animals, to achieve reliable results.
This calculator can be used to run more of these scenarios. For the above example, use:
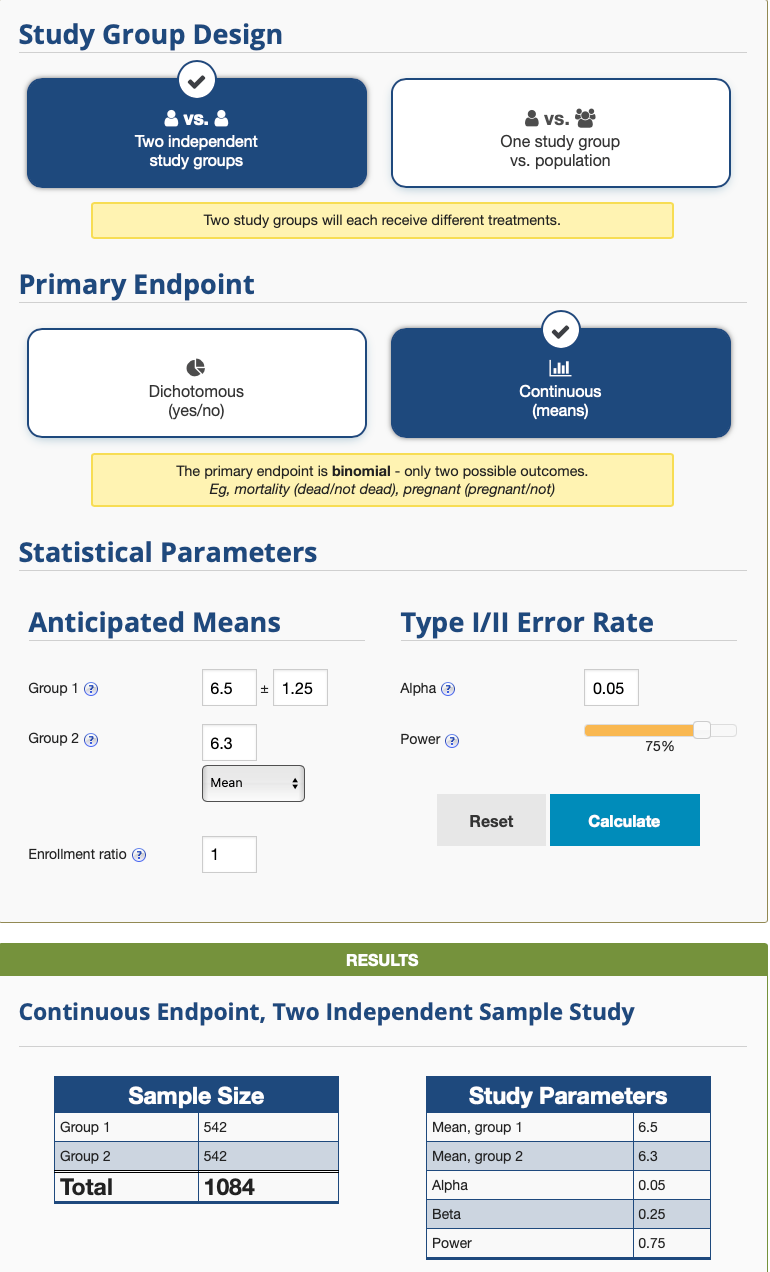
Now, let's assume our methane mitigation product reduced emissions by 70% and liberated 8.4% of feed energy (assuming a 12% original energy loss to methane). To prove this energy was converted into improved efficiency, we need to detect an 8.4% change in FCR.
With a tolerance of 5% for Type I errors and 25% for Type II errors, we’d need 72 animals per group, or 144 total animals, for at least 49–70 days, to achieve reliable results.
Even assuming the most methane-intensive animals in theoretical models and an exceptionally effective mitigating strategy that reduces methane by 70%, the study would still need to include 144 animals.
[If you are interested in an Enteric Methane specific power calculator ( NOT PRODUCTIVITY). See the calculator built by Ermias Kebreab’s lab at UC Davis, here: Enteric methane study power calculator.]
Imagine administering a product that reduces methane emissions and observing reduced DMI. This could mean:
If your study isn’t powered to detect differences in ADG or FCR, you can’t differentiate between these scenarios. Claims of “efficiency gains” without appropriate data are, at best, premature and, at worst, misleading. I lean toward the latter, because animal trials are sized (powered) according to the metrics of interest ahead of time, and researchers or sponsors of that research should be clear on the limitations.
Failure to Detect ≠ Proof of No Difference: If a study isn’t powered to detect a difference, failing to observe a difference doesn’t prove there isn’t one. It simply means the study was underpowered.
Misinterpreted data could lead you down the wrong R&D path. Take, for instance, the intersection with non-inferiority:
Non-Inferiority: Regulatory frameworks like the European Food Safety Authority’s Guidelines stress the need to demonstrate non-inferiority (no harm to productivity). Demonstrating a reduction of DMI without properly powered ADG, or other production metrics, effectively demonstrates Inferiority.
“Experiments aiming at demonstrating similarity between control and treated groups should test for equivalence or non-inferiority (i.e. alternative hypothesis stating no or minimal difference exists). Difference testing should be used when the purpose is to confirm superiority or inferiority (i.e. alternative hypothesis stating a difference exists). Additional considerations need to include: i) the magnitude of the effect that the study is designed to test and its variability; ii) the expected direction of the effect; iii) an adequate statistical power and iv) the confidence level.”
Moving the field of enteric methane mitigation forward requires rigorous science, large-scale trials, and transparent data. Productivity improvements are a critical piece of the puzzle in achieving widespread adoption of these technologies. Good scientists are working to unravel the complex mechanisms of energy transfer in the rumen, but when productivity improvements are claimed without the data to support them, it undermines the fundamental work that needs to be done.
While it is reasonable to speculate that the energy spared from methane reduction could be converted into improved productivity, investors in these technologies need to recognize the importance of the size of trials necessary to demonstrate improved productivity, and if the product reduces dry matter intake, the regulatory implications of demonstrating non-inferiority.
This also highlights a go-to-market sequencing that many fail to recognize: once you have demonstrated safety and efficacy, and have a label claim to that effect, you can move on to large-scale, post-registration, commercial trials.
When evaluating a company's strategy, experimental outlook, and the burn rate, investors should consider: What data are needed to get to market, what data are better generated once in market, and am I prepared for the time it will take to get there?
As W. Edwards Deming famously said, “In God we trust. All others must bring data.”
Many startups in the enteric methane space are now claiming that their technologies not only cut emissions but also improve productivity, helping animals convert feed more efficiently into milk or meat. These claims matter. If true, they could transform the economics of methane mitigation, creating a win-win for both climate and producers. But the evidence for these productivity gains remains weak, and in many cases, is being assumed rather than demonstrated.
The logic is appealing: reducing methane should, in theory, free up energy that could be redirected toward growth or milk production. Yet in practice, the rumen is a complex biological system, and there’s little empirical proof that this “liberated energy” translates into measurable performance improvements, and one study very robustly demonstrated that any productivity gains via the classic redirection mechanisms is likely limited ( at least for one mode of action). For many early-stage ventures, collecting that kind of rigorous productivity data is beyond their current technical or financial capacity. Still, treating productivity as a given is risky—it can distort impact estimates, mislead investors, and erode confidence in the entire field if promised gains fail to materialize.
Q. Is that a rhetorical statement, or would you like to do the math?
A: I’d like to do the math.
In livestock production, productivity boils down to how efficiently animals convert feed into products like meat or milk. For simplicity, let’s stick with beef production.
Here are a few key metrics used to evaluate productivity in livestock systems:
Feed is the largest expense in livestock operations, so improving FCR, or otherwise improving the rate of weight gain per unit of feed, directly improves both productivity and profitability. With these basics in mind, let’s look at the mechanics of enteric methane and potential productivity benefits from mitigating it.
Enteric methane represents 2–12% of the energy from feed in ruminant livestock like cattle, sheep, and goats, with an average of around 6%. Factors such as breed, diet, and the rumen microbiome influence this percentage.
Now, assume we have a product that reduces enteric methane by 50%. That liberates 3% of the energy from feed that could—potentially—be redirected into productivity gains like increased meat or milk production. But does it? This is where things get tricky.
Demonstrating that a 3% energy liberation improves Feed Conversion Ratio (FCR) is not as simple as it sounds. Measuring Dry Matter Intake (DMI) and Average Daily Gain (ADG) accurately requires contending with both variability and uncertainty in the data. Even if we reduce methane by 50%, productivity would improve by at most 3%. And you don't need to be a statistician to know that it's much harder to detect a 3% change than a 50% one. After all, it's much easier to tell when someone is 2 feet taller than when they’re only 2 inches taller.
DMI measurements are relatively straightforward in controlled experimental settings (though they are much more difficult with grazing animals). Feed intake is closely monitored, and smart feeding systems can weigh feed given and feed left uneaten. While minor variability exists (e.g., feed spilling), these systems are robust, and uncertainty in DMI measurements is minimal.
ADG, on the other hand, is a different beast. Even animals of the same breed, diet, and rough size show enormous variability in daily weight gain. For example, a 300 kg steer might gain anywhere from 0.8 to 2 kg per day, depending on individual factors.
To reduce variability and improve accuracy, trials must last 49–70 days or longer, allowing daily fluctuations in weight to average out. This is because factors like water intake, time since last feed intake, bowel movements, and scale error can cause day-to-day weight variations of 5–18 kilograms, dwarfing the small daily weight gains we’re trying to measure.
The Statistical Challenge of Detecting Efficiency Gains
Let’s consider an average scenario first, then we will consider a very generous scenario:
For both, we will use the following assumptions:
First, let’s assume our methane mitigation product reduced emissions by 50% and liberated 3% of feed energy (assuming a 6% original energy loss). To prove this energy was converted into improved efficiency, we need to detect a 3% change in FCR.
Detecting this small effect size requires powering the study to minimize Type I errors (false positives, also known as alpha) and Type II errors (false negatives, also known as beta). With a tolerance of 5% for Type I errors and 25% for Type II errors (typical for ruminant studies), we’d need 542 animals per group, or 1,084 total animals, to achieve reliable results.
This calculator can be used to run more of these scenarios. For the above example, use:
Now, let's assume our methane mitigation product reduced emissions by 70% and liberated 8.4% of feed energy (assuming a 12% original energy loss to methane). To prove this energy was converted into improved efficiency, we need to detect an 8.4% change in FCR.
With a tolerance of 5% for Type I errors and 25% for Type II errors, we’d need 72 animals per group, or 144 total animals, for at least 49–70 days, to achieve reliable results.
Even assuming the most methane-intensive animals in theoretical models and an exceptionally effective mitigating strategy that reduces methane by 70%, the study would still need to include 144 animals.
[If you are interested in an Enteric Methane specific power calculator ( NOT PRODUCTIVITY). See the calculator built by Ermias Kebreab’s lab at UC Davis, here: Enteric methane study power calculator.]
Imagine administering a product that reduces methane emissions and observing reduced DMI. This could mean:
If your study isn’t powered to detect differences in ADG or FCR, you can’t differentiate between these scenarios. Claims of “efficiency gains” without appropriate data are, at best, premature and, at worst, misleading. I lean toward the latter, because animal trials are sized (powered) according to the metrics of interest ahead of time, and researchers or sponsors of that research should be clear on the limitations.
Failure to Detect ≠ Proof of No Difference: If a study isn’t powered to detect a difference, failing to observe a difference doesn’t prove there isn’t one. It simply means the study was underpowered.
Misinterpreted data could lead you down the wrong R&D path. Take, for instance, the intersection with non-inferiority:
Non-Inferiority: Regulatory frameworks like the European Food Safety Authority’s Guidelines stress the need to demonstrate non-inferiority (no harm to productivity). Demonstrating a reduction of DMI without properly powered ADG, or other production metrics, effectively demonstrates Inferiority.
“Experiments aiming at demonstrating similarity between control and treated groups should test for equivalence or non-inferiority (i.e. alternative hypothesis stating no or minimal difference exists). Difference testing should be used when the purpose is to confirm superiority or inferiority (i.e. alternative hypothesis stating a difference exists). Additional considerations need to include: i) the magnitude of the effect that the study is designed to test and its variability; ii) the expected direction of the effect; iii) an adequate statistical power and iv) the confidence level.”
Moving the field of enteric methane mitigation forward requires rigorous science, large-scale trials, and transparent data. Productivity improvements are a critical piece of the puzzle in achieving widespread adoption of these technologies. Good scientists are working to unravel the complex mechanisms of energy transfer in the rumen, but when productivity improvements are claimed without the data to support them, it undermines the fundamental work that needs to be done.
While it is reasonable to speculate that the energy spared from methane reduction could be converted into improved productivity, investors in these technologies need to recognize the importance of the size of trials necessary to demonstrate improved productivity, and if the product reduces dry matter intake, the regulatory implications of demonstrating non-inferiority.
This also highlights a go-to-market sequencing that many fail to recognize: once you have demonstrated safety and efficacy, and have a label claim to that effect, you can move on to large-scale, post-registration, commercial trials.
When evaluating a company's strategy, experimental outlook, and the burn rate, investors should consider: What data are needed to get to market, what data are better generated once in market, and am I prepared for the time it will take to get there?
As W. Edwards Deming famously said, “In God we trust. All others must bring data.”
Stay in touch
Sign up to our Spark newsletter and stay updated!
Menu
Stay in touch
Sign up to our Spark newsletter and stay updated!