Explainer

Warming-Induced Emissions: Global Estimates

As the planet heats up, permafrost, wildfires, wetlands, and freshwaters are starting to release greenhouse gases of their own—on top of everything human activity and infrastructure already emit—driving up global temperatures. These processes, collectively referred to as warming-induced emissions, are among the biggest blind spots in climate models and policies. New research provides better estimates of the scale of these feedbacks.

September 2026

This explainer is a product of partnership between scientists at Spark Climate Solutions, the Environmental Defense Fund, Woodwell Climate Research Center, and Stanford University.

Based on the recent paper: Abernethy, S., Monteverde, D., Schädel, C., Buma, B., Duffy, P. B., Jackson, R. B., Natali, S. M., Ocko, I., Rogers, B. M., & Poulter, B. · “Projected amplification of global warming by warming-induced greenhouse gas emissions” · Environmental Research Letters, 2026

Spark Climate Solutions Environmental Defense Fund Woodwell Climate Research Center Stanford University

The Warming Feeds the Warming

Scientists have long anticipated that rising temperatures could trigger more emissions from natural sources as they warm, which in turn would lead to even more warming. In 1986, legendary ecologist George Woodwell described this phenomenon as ‘the warming feeds the warming’. Perhaps the best known—but as this explainer shows, not the only—example is permafrost thaw. As the planet warms, permafrost thaws, releasing carbon that has been frozen for centuries. These carbon dioxide and methane emissions trap heat, causing more warming, driving further thaw, and even more emissions in a self-reinforcing feedback loop.

Despite this phenomenon being well known, quantifying and modeling these Earth system feedbacks across different types of warming natural systems for the entire planet remains extremely difficult. Thus, the full amount of warming these effects will cause has long remained poorly understood and thus excluded from climate policy. Specifically, warming-induced emissions are left out of pledges, targets, and emissions inventories under the UNFCCC.

Now researchers have more robust estimates.

Temperature impacts of selected warming-induced emissions sources
Interactive: explore how warming-induced emissions grow under different scenarios
Uncertainty

Note that there are uncertainties associated with the timing and total magnitude of these estimates from the processes and from the climate sensitivity using the MAGICC model. Combined estimate shown above (1 standard deviation in 2100: ±0.2°C). Also note that the estimates of warming for individual sources, when added up, is higher than the estimate of total warming if all sources are combined together because of nonlinearities in the radiative forcing functions for CO2 and CH4.

Source: Abernethy et al., 2026.

Permafrost contains a huge reservoir of soil carbon that has stayed frozen for thousands of years, locking away ancient plant and animal remains. As it thaws, microbes break that organic matter down, releasing carbon dioxide where the soil stays dry, or methane in wetter, oxygen-poor pockets. Because deeper layers can take decades to thaw, this source keeps growing long after the warming that started it.

Wildfires: hotter, drier conditions let forests burn more often, more intensely, and over more area. Burning releases the carbon stored in trees and leaf litter straight into the air as carbon dioxide, plus methane from the oxygen-starved smoldering of dense underbrush and peat.

Despite the important role of wetlands as a carbon sink, wetlands are the world’s largest natural methane source. Their soils are waterlogged and deprived of oxygen, so the microbes breaking down dead plant matter produce methane instead of carbon dioxide. Warmer temperatures speed up that microbial process, making wetlands an even bigger methane source.

Freshwaters: as lakes, ponds, and rivers warm, microbial activity in the sediment speeds up, releasing more methane. In some regions, warming also means more open (rather than frozen) water for more of the year, which adds even more surface area for methane to escape from.

Can we still bend the emissions curve downward? Warming-induced emissions aren’t fixed. They change in response to how human emissions drive temperature change. Use the toggle below to see how the warming changes under different scenarios.

The amount of warming that comes from these natural systems is directly related to the amount of warming from human-caused direct emissions. If human emissions decline, so too do warming-induced emissions. However, some amount of warming-induced emissions may already be locked in, which is an active area of research.

Key Stats

The figures below, which are drawn from Abernethy et al., 2026, include significant uncertainties (see Uncertainty section below). A larger multi-model intercomparison project—the Warming-Induced Emissions Model Intercomparison Project (WIEMIP)—which is now underway, aims to produce more comprehensive estimates of these emissions.

0.2-0.4°C
Extra warming these feedbacks could add by 2100 under different scenarios
Uncertainty

1 standard deviation: ±0.2°C.

20-30%
Approximately how much these feedbacks might amplify post-2020 global warming this century
Uncertainty

Central estimate and 1 standard deviation by scenario: 30% ±30% under SSP1-2.6; 25% ±15% under SSP2-4.5; 20% ±10% under SSP4-6.0.

0
Number of the 11 Earth system models used in the most recent IPCC assessment (AR6) that included all four key warming-induced emissions sources
Learn more

2 included permafrost; 5 included wildfire; none included wetlands and freshwaters.

That’s because modeling these feedbacks well is extremely difficult. It means predicting how every ecosystem on Earth responds to warming, folding in data from key hot spots like Siberia and the Congo Basin that remain data-poor, and reconciling ongoing scientific disagreements on various points.

Despite their magnitude, warming-induced emissions have remained poorly understood and are absent from most of the models used to inform climate policy. This means that most current climate projections likely underestimate future warming.

Dr. Ben Poulter

Warming-induced emissions aren’t a new idea. Scientists have been sounding the alarm to policy makers about greenhouse gas climate feedbacks since before the 1986 Senate hearings with James Hansen, Wally Broecker, and George Woodwell. What is new is that this study begins to illustrate the magnitude of the challenge we face to maintain a safe and stable climate. It should be a wake-up call to better understand these dynamics, rethink policies, explore potential solutions, and most importantly, urgently reduce human emissions.

Dr. Ben Poulter · Program Director and Lead Scientist, Warming-Induced Emissions, Spark Climate Solutions

What are Warming-Induced Emissions?

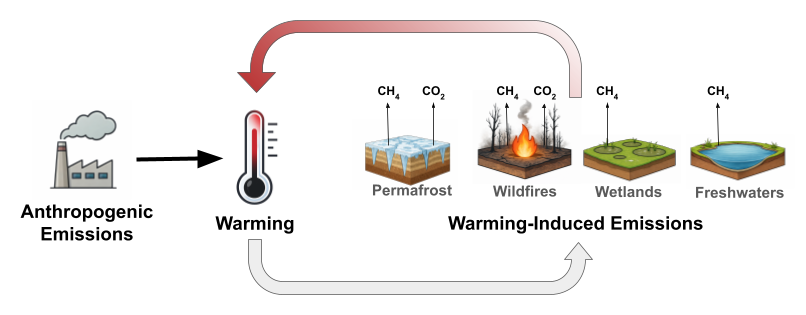
Rising temperatures, shifting precipitation patterns, increasing droughts, and other impacts from climate change are causing many natural systems to undergo profound changes. Some of these changes result in more greenhouse gas emissions, including not only carbon dioxide but also methane and nitrous oxide, which are highly potent super pollutants. These greenhouse gas climate feedbacks add to direct human-driven emissions and amplify global warming in a self-perpetuating cycle.

Diagram: anthropogenic emissions cause warming, which triggers warming-induced emissions of methane and carbon dioxide from permafrost, wildfires, wetlands, and freshwaters, which cause further warming, closing the feedback loop.

Long anticipated by scientists, there is now growing evidence that some of these changes have already begun.

These warming-induced emissions will amplify global warming and pose a significant risk to maintaining a safe and stable climate.

How much will these systems emit globally?

Explore the magnitude of carbon dioxide and methane emissions under different scenarios.

Interactive: explore how warming-induced emissions grow under different scenarios

Source: Abernethy et al., 2026.

Dr. Christina Schädel

Scientists including myself have been studying different aspects of these systems, and raising alarm bells about how they are changing, for years. But when you put all the pieces together like this, the impacts are truly staggering. These are often remote ecosystems, but the emissions they produce affect everyone, no matter where home is. It’s a truly global phenomenon.

Dr. Christina Schädel · Senior Research Scientist, Woodwell Climate Research Center

Learn more

Better understanding the drivers of these natural emissions and how they will evolve under a warming world is critical if we are to return to a safe and stable climate. Continue reading to explore the different sources of warming-induced emissions in more detail, and to learn about emerging efforts to better manage these risks through improved modeling, monitoring, policies, and mitigation.

Four key sources

Learn more about how each source of warming-induced emissions is changing, and how that will impact emissions and temperatures in different scenarios.

Permafrost
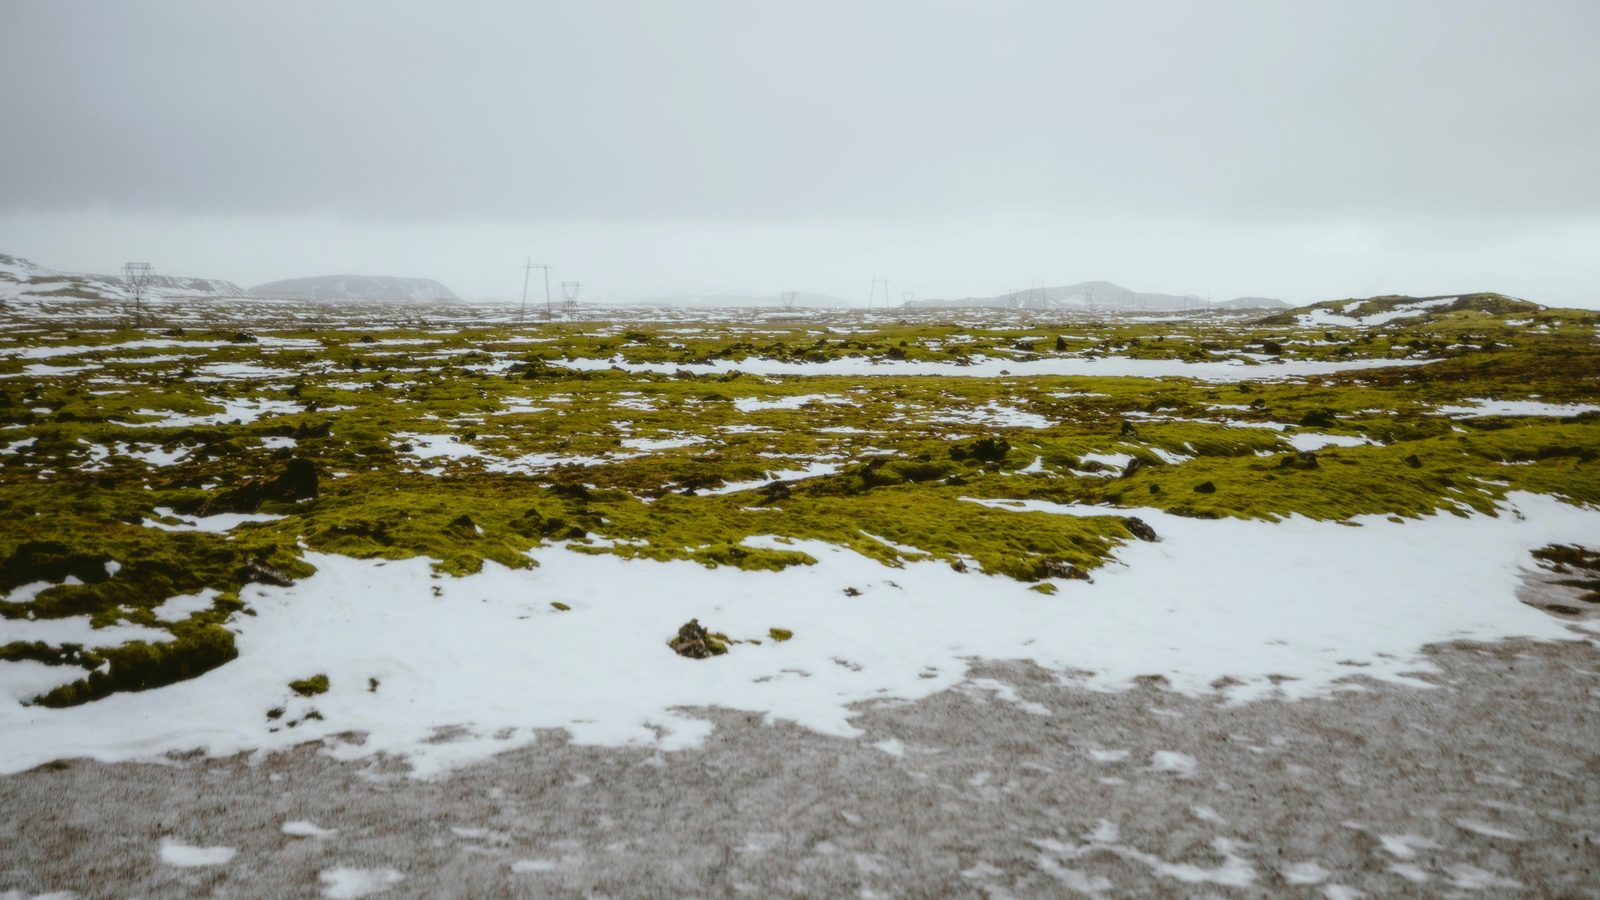
Snow-patched permafrost tundra landscape with moss and lichen ground cover, under an overcast sky.

Photo: Alin Gavriliuc / Unsplash

Permafrost is ground that stays frozen year-round, often for thousands of years. Permafrost holds an enormous amount of carbon from old, partially undecomposed plant and animal matter. Imagine a walk-in freezer the size of a continent, packed with carbon that has been in cold storage since before the last ice age ended.

As it thaws, that organic matter starts to break down. In drier ground, it decomposes with oxygen and releases carbon dioxide. In wetter, waterlogged ground, it decomposes without oxygen and releases even more potent methane instead. The thaw process itself takes several forms: gradual as the ground slowly warms year over year, or abrupt when whole sections rapidly thaw and collapse, for example when massive ground ice melts. Wildfire can also speed up thaw by stripping away the insulating layer of vegetation on top, though how much depends on local ice content, soil conditions, and fire severity.

Permafrost’s carbon is different from the carbon in wetland or freshwater vegetation in that those other sources are already part of the active carbon cycle, but permafrost thaw introduces carbon that has been locked out of that cycle (often for a very long time), similar to burning fossil fuels. Permafrost thaw also responds to past warming with a significant lag, so emissions can keep rising for decades even after temperatures stabilize.

Note that this explainer covers permafrost soil carbon specifically, not methane clathrates (gas hydrates).

A simplified picture of warming-induced emissions from permafrost
Climate change Warmer temperatures Frozen soil thaws, releasing stored carbon Dry conditions: carbon breaks down with oxygen, forming carbon dioxide Wet conditions: carbon breaks down without oxygen, forming methane Increased carbon dioxide & methane emissions
Dr. Susan Natali

The rate of change in the Arctic has accelerated more than expected, and people are living with impacts, daily and inescapably. We are working to ensure policy-makers understand the local to global consequences of thawing permafrost.

Dr. Susan Natali · Senior Scientist, Woodwell Climate Research Center

By 2100, one estimate shows permafrost adding:

0.08-0.24°C
Approximately how much additional warming by 2100, carbon dioxide and methane combined
Uncertainty

This range shows the central values across three scenarios from Abernethy et al., 2026. See the Uncertainty section below for more information.

Carbon dioxide provides the larger share of that combined warming: about 0.05-0.17°C from permafrost carbon dioxide versus 0.04-0.06°C from permafrost methane.

All numbers are modeled estimates. Gradual and post-fire thaw use a fixed 2.3% methane contribution, but abrupt thaw estimates methane and carbon dioxide separately by landscape type from field data, so for abrupt thaw the methane proportion isn’t fixed and shifts as thaw stages change over time.

Temperature and emissions impacts from permafrost
Interactive: explore how warming-induced emissions grow under different scenarios

Source: Abernethy et al., 2026.

Wildfire
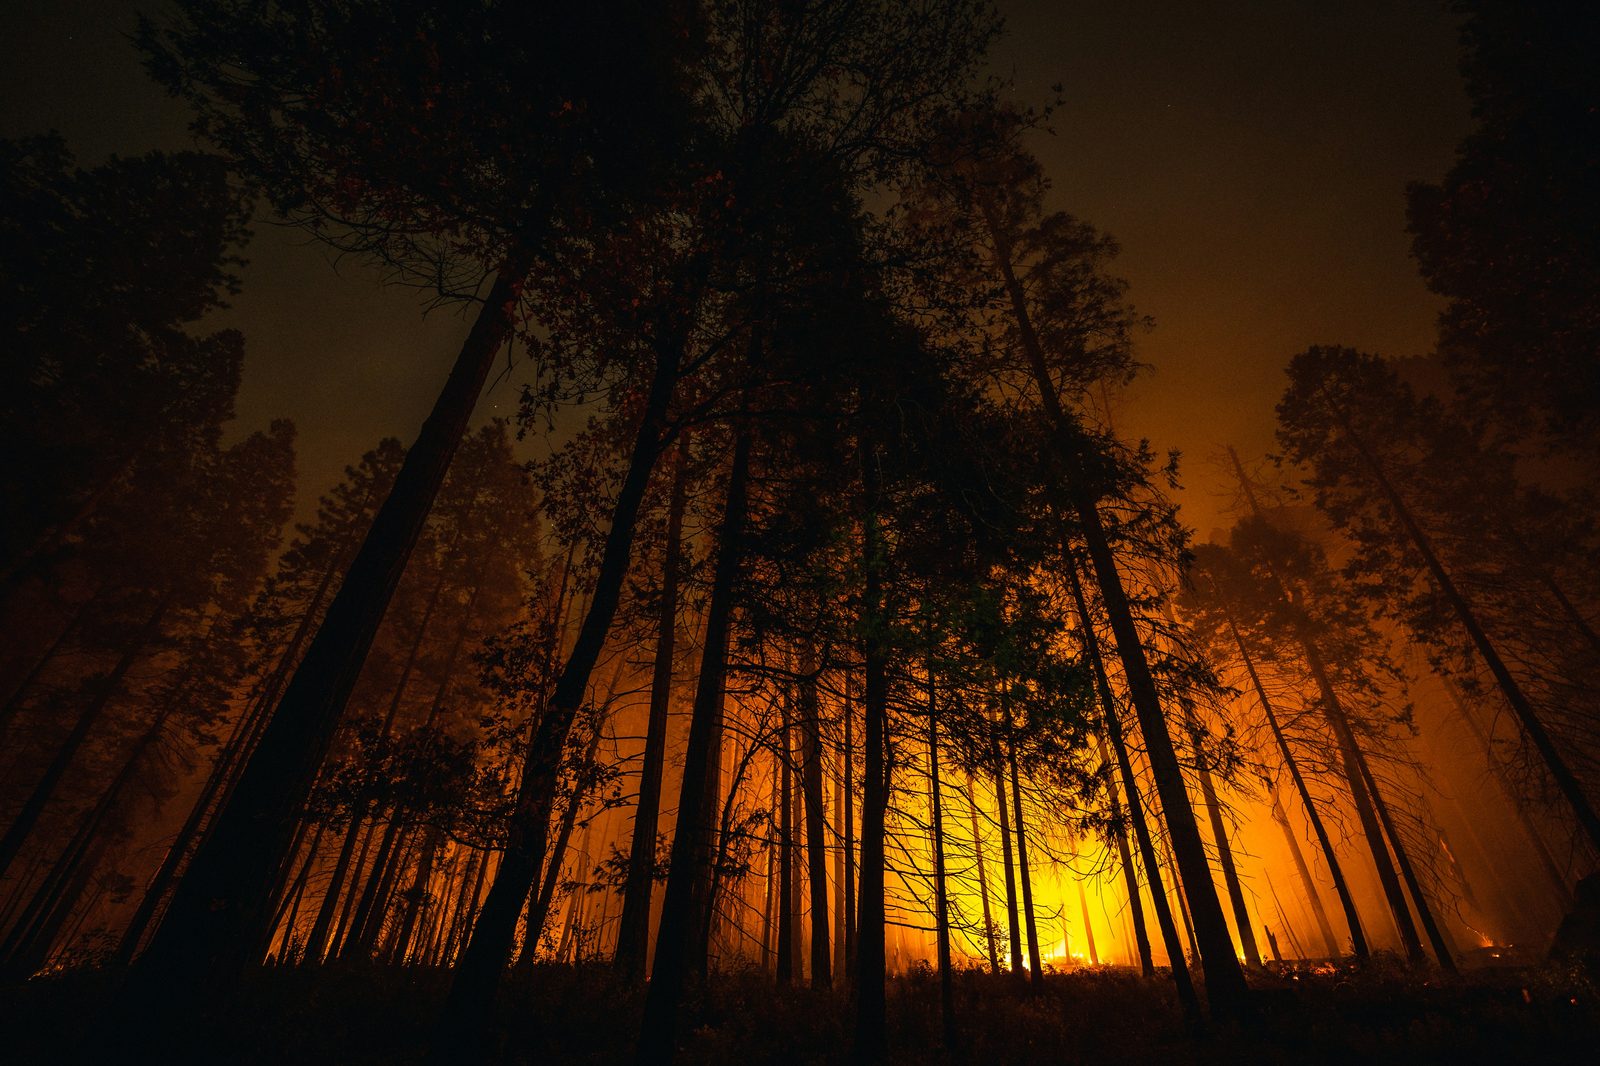
A wildfire burning through a forest at night, glowing orange behind silhouetted trees.

Photo: Casey Horner / Unsplash

To burn big, wildfires need dry fuel and heat. While wildfires are a natural and important part of many ecosystems, warming makes extreme conditions more likely in many parts of the world. It dries out vegetation, including combustible litter and ladder fuels, and stretches out the fire season, so forests that used to burn every few decades start burning more often, and more intensely, than they used to. Although that carbon can recover as the forest regrows, that process can take a century, and if the overall rate of burning keeps climbing, it means a net increase of carbon in the atmosphere.

Burning releases carbon dioxide immediately, the same way any combustion does. But not everything burns cleanly. Smoldering fires, the slow, low-oxygen kind that creep through peat and deep leaf litter rather than flaming outright, release methane on top of the carbon dioxide. Burning can also destabilize permafrost and burn deep into tropical peatlands.

A simplified picture of warming-induced emissions from wildfire
Climate change Hotter, drier conditions Dried-out forests burn more More complete combustion (dry vegetation and woody fuels) produces primarily carbon dioxide Smoldering combustion (peat, soils, and other dense organic fuels) produces carbon dioxide and proportionally more methane Increased carbon dioxide & methane emissions
Dr. Brian Buma

Wildfire is perhaps the most visible part of this puzzle. Forests that used to burn once a century are now burning every decade, and an overall increase in wildfire reduces the overall amount of carbon stored on the land. We need land management, innovative science and technology, and climate policy that treats this as the ongoing feedback it is, not one-off disasters.

Dr. Brian Buma · Senior Climate Scientist, Environmental Defense Fund

By 2100, one estimate shows wildfire adding:

0.05-0.09°C
Approximately how much additional warming by 2100, carbon dioxide and methane combined
Uncertainty

This range shows the central values across three scenarios from Abernethy et al., 2026. See the Uncertainty section below for more information.

Carbon dioxide provides the larger share of that combined warming: about 0.04-0.07°C versus 0.01-0.02°C from methane.

Temperature and emissions impacts from wildfire
Interactive: explore how warming-induced emissions grow under different scenarios

Source: Abernethy et al., 2026.

Wetlands
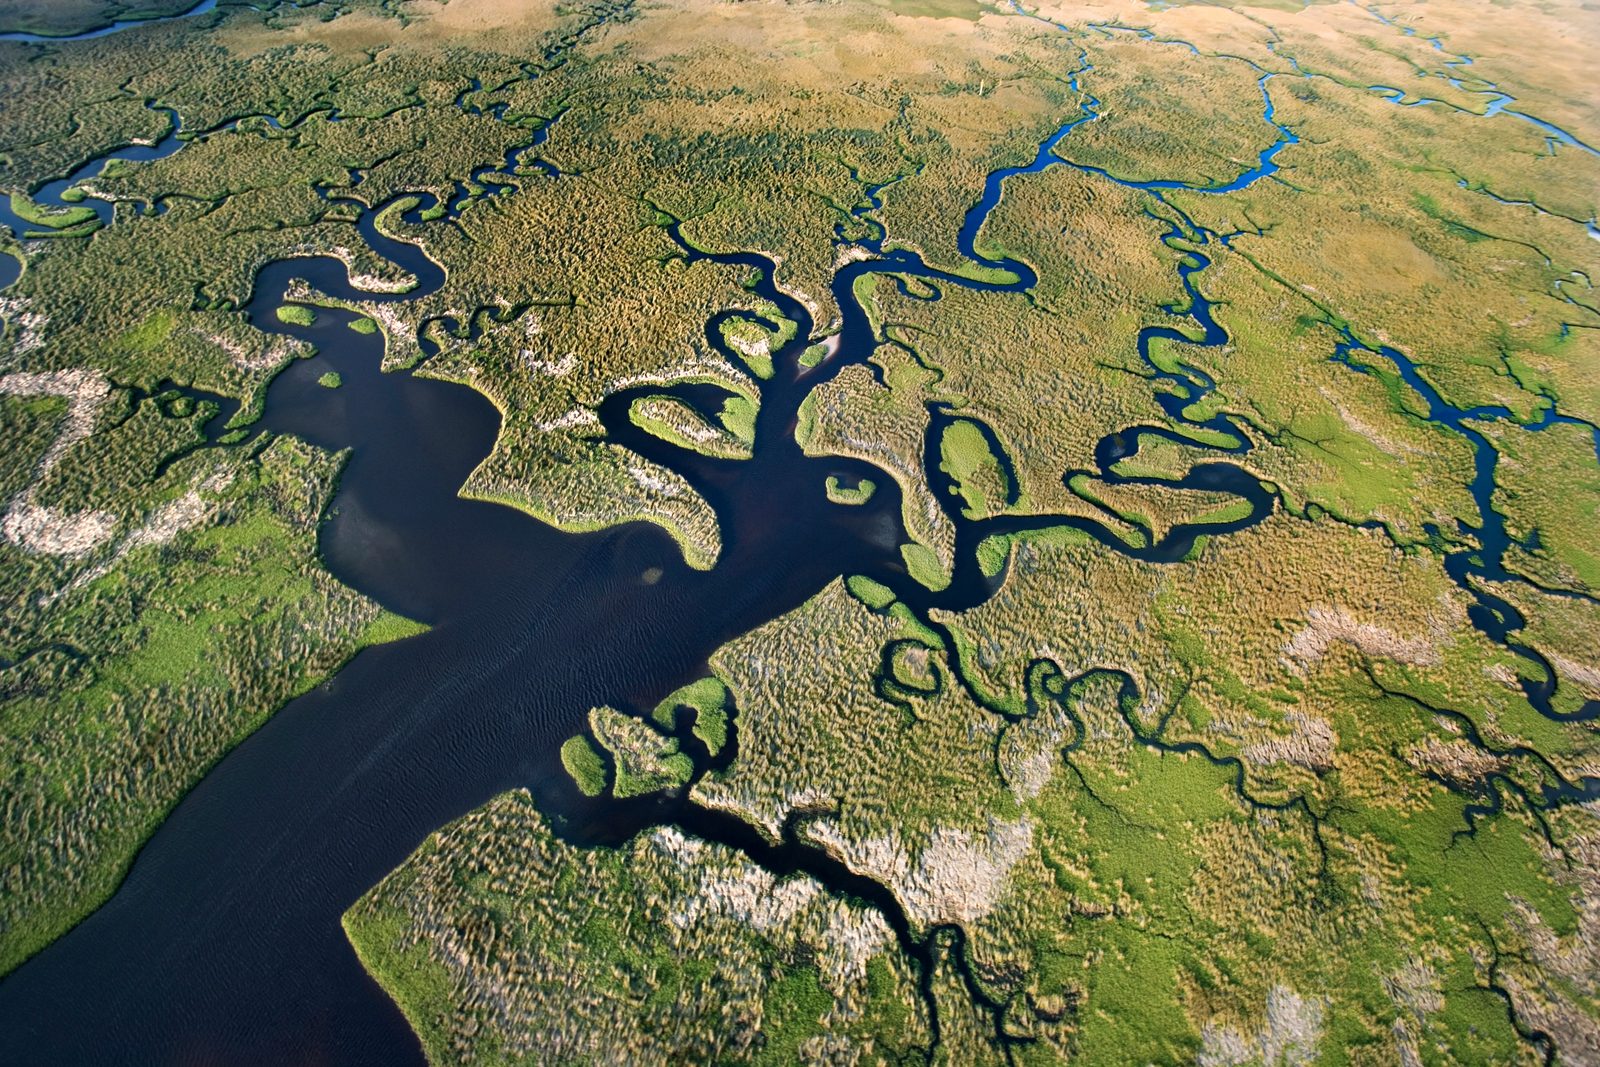
Aerial view of a winding wetland delta with marsh grasses and branching water channels.

Photo: Getty Images / Unsplash

Wetlands are already the largest natural source of methane on the planet. Swamps, marshes, and peatlands are where waterlogged soil creates the oxygen-starved anaerobic conditions certain microbes need to survive. Those microbes break down organic matter and produce methane as a byproduct, a process called methanogenesis.

Wetlands, like other natural emission sources, do not contribute to additional warming if their emissions remain stable over time. The problem is that human-caused climate change is causing these systems to emit more than they would otherwise.

An important source of these emissions is the tropics, where wetlands are warmest, wettest, and most active year-round. This is also where our ability to track these emissions through ground-based monitoring systems is thinnest.

A simplified picture of warming-induced emissions from wetlands
Climate change Warmer Wetter Microbes break down dead plants faster, forming methane Wetlands flood longer each year, over more land Increased methane emissions
Dr. Robert Jackson

Wetlands are the world’s largest natural methane source, and they’re already releasing more methane with warming. If we’re serious about tracking progress toward climate goals, we have to account for how wetlands in nature are responding to warming.

Dr. Robert Jackson · Provostial Professor, Stanford University · Chair, Global Carbon Project

By 2100, one study shows wetland adding:

0.05-0.08°C
Approximately how much additional warming by 2100
Uncertainty

This range shows the central values across three scenarios from Abernethy et al., 2026. See the Uncertainty section below for more information.

Temperature and emissions impacts from wetlands
Interactive: explore how warming-induced emissions grow under different scenarios

Source: Abernethy et al., 2026.

Note that: temperature impacts in SSP2 and SSP4 are similar due to SSP4 being an extremely high anthropogenic methane scenario.

Freshwaters
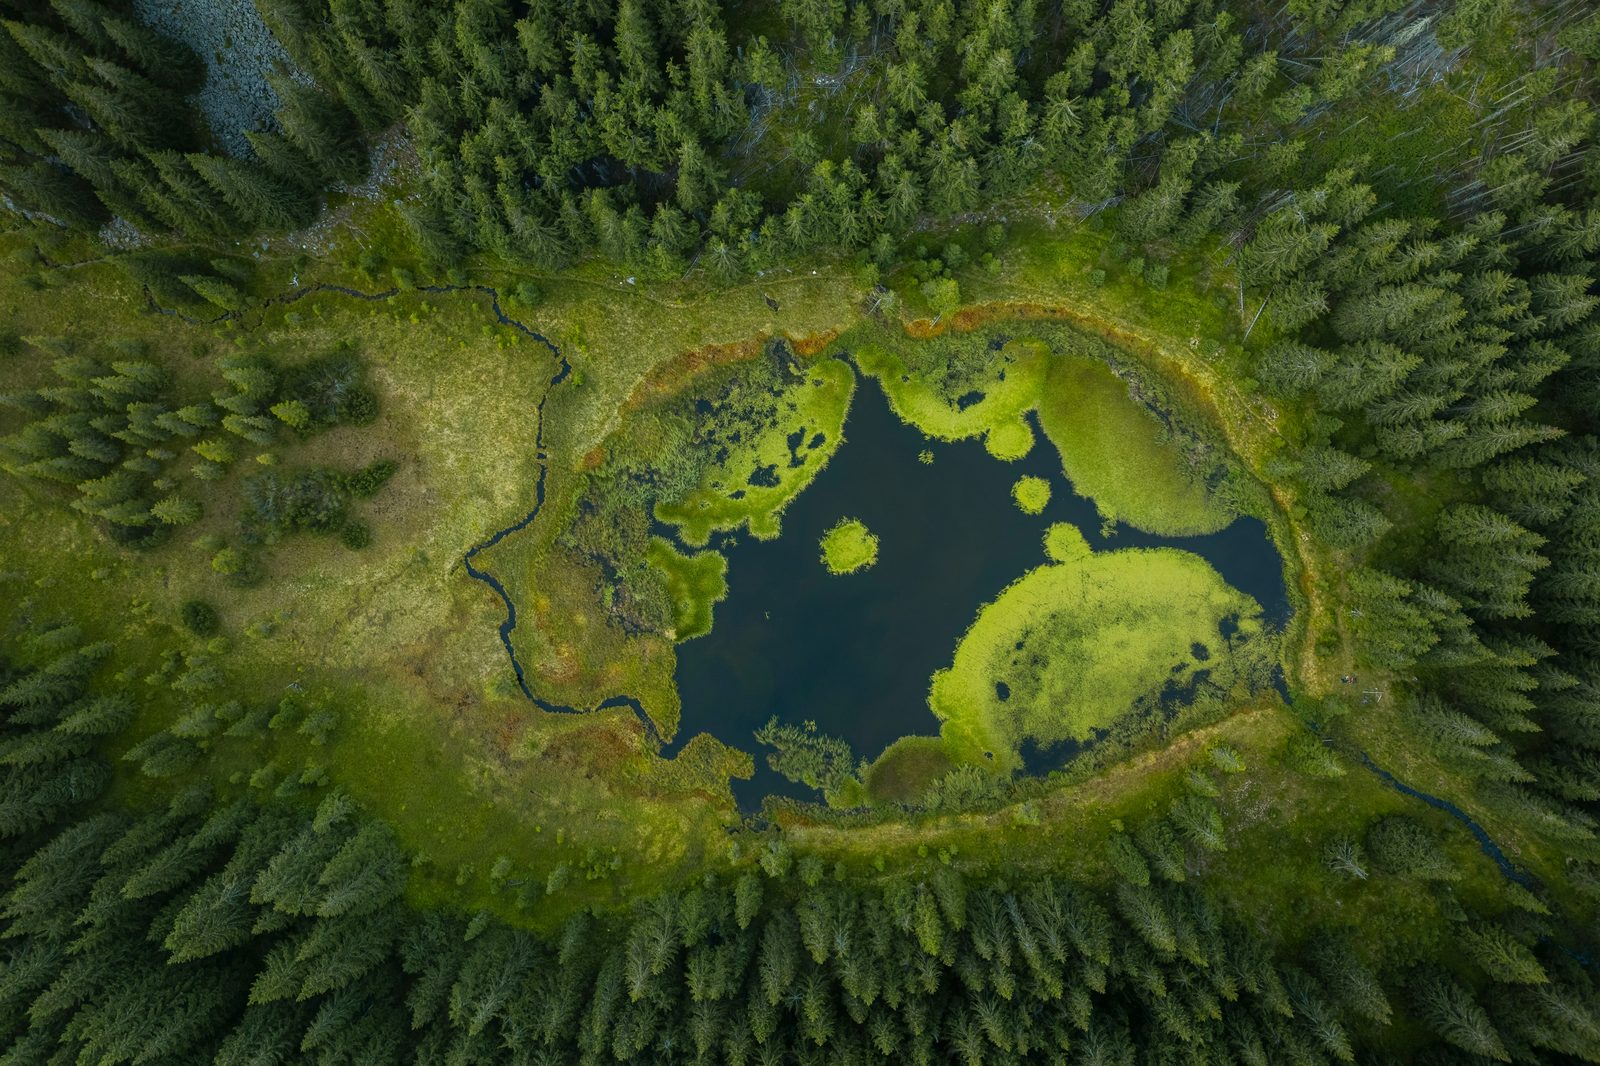
Aerial view of a small forest pond surrounded by dense evergreen trees.

Photo: Daniel Mirlea / Unsplash

Lakes, reservoirs, ponds, streams and rivers don’t usually come up in conversations about climate feedbacks, but they’re already responsible for roughly a tenth of the world’s methane emissions.

As they warm, microbial activity in the sediment speeds up, and methane escapes more easily as bubbles rising to the surface, a process called ebullition. In some regions, warming also means more open, unfrozen water for more of the year, which adds even more surface area for methane to escape from.

A simplified picture of warming-induced emissions from freshwaters
Climate change Warmer temperatures Microbes break down organic matter faster, forming methane More open, unfrozen water for more of the year Increased methane emissions
Dr. Sam Abernethy

While emissions from freshwaters aren’t huge compared to some other sources, this is a good example of an under-examined source that scientists didn’t have solid numbers on until quite recently. That’s concerning because it implies there may be other sources of warming-induced emissions out there that we still don’t understand well, and the cumulative effect of those additional sources could be significant.

Dr. Sam Abernethy · Research Scientist, Spark Climate Solutions

By 2100, one estimate shows freshwaters adding:

0.01-0.02°C
Approximately how much additional warming by 2100
Uncertainty

This range shows the central values across three scenarios from Abernethy et al., 2026. See the Uncertainty section below for more information.

Temperature and emissions impacts from freshwaters
Interactive: explore how warming-induced emissions grow under different scenarios

Source: Abernethy et al., 2026.

Note that: temperature impacts in SSP2 and SSP4 are similar due to SSP4 being an extremely high anthropogenic methane scenario.

Four key gaps

Better quantification of warming-induced emissions is only the first step. To limit the risks these feedbacks will create, we need to overcome four barriers to effective climate action.

The monitoring gap

Today’s greenhouse gas monitoring networks are inadequate for tracking natural sources: they were built mostly to track human emissions, which are concentrated in different geographies than warming-induced emissions. While monitoring infrastructure for natural sources—which were assumed to be relatively stable—is very sparse. (Watts et al.). For methane in particular, this creates major blind spots. The highest-risk regions, like the Congo Basin, the Amazon, and Siberian lowlands, are poorly observed. A natural methane surge could run for years before it’s discovered.

The modeling gap

Because of technical, data, and coordination challenges, most global climate models used to inform national emissions targets and remaining carbon budgets don’t yet fully account for these feedbacks, so they are likely underestimating how much the planet will actually warm. We need improved modeling, like the Warming-Induced Emissions Model Intercomparison Project (WIEMIP), so decision makers are given a fuller assessment of risks.

The policy gap

Global policy frameworks—like the UNFCCC and the Paris Agreement—focus on anthropogenic emissions as the main culprit for climate change (which was especially true when these policy mechanisms were created). However, warming-induced emissions are left out even as they draw down the remaining carbon budget and push the goal of limiting temperature increases further out of reach (Buma et al.). We need to account for these feedbacks in policies so climate commitments reflect the real remaining carbon budget, and in order to motivate adoption of measures to control these emissions. Otherwise, we risk meeting our targets only to realize they were insufficient.

The solutions gap

Cutting human emissions from all sources (fossil fuels, agriculture, waste, and more) as much as possible is the easiest and most important way to limit these feedbacks. It may also be possible to reduce warming-induced emissions through targeted measures, such as fire management, wetland water-level control, permafrost stabilization, or new novel approaches. We need a larger research effort to determine which interventions would work, at what scale, and whether their benefits would outweigh any potential ecological and social risks.

Dr. Danielle Potocek

These challenges are too big for any one organization to take on alone. Closing the modeling, monitoring, policy, and solutions gaps is going to take scientists, funders, governments and institutions working together. The strength of this partnership is that each organization brings something different, allowing our collective efforts to be greater than what any of us could accomplish independently.

Dr. Danielle Potocek · Deputy Director, Warming-Induced Emissions, Spark Climate Solutions
A collaborative effort

Spark Climate Solutions, the Environmental Defense Fund, Woodwell Climate Research Center, and Stanford University are collaborating while each leading work on different pieces of this challenge.

Learn more about what Spark is doing on modeling, policy, and mitigation roadmapping: click here.

Learn more about what EDF is doing on innovative science and technology, developing new mitigation options, and policies to reduce global emissions: click here.

Learn more about what Woodwell is doing to monitor climate change, study its impact and develop scalable solutions: click here.

Learn more about what Stanford is doing on methane and climate change: click here.

Uncertainty

Projecting future warming-induced emissions inherently involves uncertainty. First, how much they grow depends on how much humans emit, which is why every figure in this explainer lets you toggle between different anthropogenic emissions scenarios.

Second, even within one scenario, the magnitude of warming-induced emissions is uncertain. This is mostly because of the limited amount of independent research on how each source’s emissions respond to warming, gaps in current modeling frameworks, and data limitations.

Third, there is uncertainty in the underlying processes themselves. For example, permafrost thaw releases carbon that either becomes carbon dioxide or methane depending on variability in local conditions, such as how wet the soil is. Because methane is far more potent than carbon dioxide in the near term, the ratio of how much permafrost carbon ends up as methane vs carbon dioxide has implications for warming—and the exact ratio cannot be fully predicted in advance globally. (We use a mix of carbon dioxide to methane ratios for gradual, abrupt, and post-fire thaw.) There are process uncertainties related to other warming-induced emissions sources as well.

Due to uncertainties, the statistical low-to-high range for each source is large, and the combined range across all four sources is even larger. Narrowing that range will require more research, monitoring, and a coordinated modeling effort (which is already underway).

The figures in this explainer use the central estimate from each scenario (Abernethy et al., 2026). The graphic below also shows a combined uncertainty range to illustrate the scale of uncertainty about these feedbacks and to highlight the need for more research to reduce it: using IPCC AR6 conventions, the graph shows the central estimate, a combined “likely” range (∼66% of outcomes), and a wider “very likely” range (∼90% of outcomes) using the standard normal values for those bands.

Note that in some cases, the low end of the range goes below zero. That is due to statistical reasons, not physical ones. Stacking the uncertain low-end estimates for each of the four individual sources together can push the combined impact below zero. However, in reality, these feedbacks are expected to have a warming effect, not a cooling effect.

Combined warming, with uncertainty range
Central estimate Likely range (∼66%) Very likely range (∼90%)
Interactive: see how the uncertainty range changes under different scenarios
Source

Abernethy et al., 2026.
What this explainer doesn’t cover

It is also important to note that the research presented in this explainer covers changes to four key systems (permafrost, wildfires, wetlands, and freshwaters) that scientists understand well enough to estimate. There are other types of warming-induced emissions that aren’t included here, mainly because there isn’t enough evidence to put reliable numbers on them, such as warming-induced nitrous oxide emissions from warming soils.

This research also doesn’t include feedbacks that go the other way, providing a cooling effect, such as aerosol feedbacks.

It is also important to note that warming-induced emissions are one important category of climate feedback, but not the only one. Other climate feedbacks, such as cloud feedbacks which contribute to Earth’s declining reflectivity, pose major risks as well. The research presented in this explainer focuses only on a subset of warming-induced emissions, not all types of climate feedbacks.

References
  1. 1. Abernethy, S., Monteverde, D., Schädel, C., Buma, B., Duffy, P. B., Jackson, R. B., Natali, S. M., Ocko, I., Rogers, B. M., & Poulter, B. (2026). Projected amplification of global warming by warming-induced greenhouse gas emissions. Environmental Research Letters. Data & code: doi:10.5281/zenodo.19445902.
  2. 2. Watts, J. D., Ordway, E., Malone, S. L., et al. (2026). A global methane observation system to track climate feedbacks for verifiable climate impact. Science, 391(6792). doi:10.1126/science.aef0459.
  3. 3. Schädel, C. et al. (2026). Permafrost and wildfire carbon emissions indicate need for additional action to keep Paris Agreement temperature goals within reach. Communications Earth & Environment, 7, 306.
  4. 4. Zhang, Z. et al. (2017). Emerging role of wetland methane emissions in driving 21st century climate change. Proceedings of the National Academy of Sciences, 114, 9647-9652.
  5. 5. Bastviken, D., & Johnson, M. S. (2025). Future methane emissions from lakes and reservoirs. Nature Water, 3, 1397-1410.
  6. 6. Verjans, V. et al. (2025). Quantifying carbon dioxide forcing effects on lightning, wildfires, and climate interactions. Science Advances, 11, eadt5088.
  7. 7. Yale Environment 360 (2026). Nature’s Own Emissions Gap in Climate Models. e360.yale.edu/features/warming-induced-ecosystem-emissions.
  8. 8. Spark Climate Solutions. WIEMIP: Warming-Induced Greenhouse Gas Emissions Model Intercomparison Project. sparkclimate.org/warming-induced-emissions/wie-mip.
  9. 9. Ciais, P., Zhu, Y., Cai, Y., et al. (2026). Why methane surged in the atmosphere during the early 2020s. Science. doi:10.1126/science.adx8262.